Duct System Design Guide
 |
| how to design ws duct system |
How to design a duct system. In this article, we will learn how to size and design a duct system to be efficient. We will include a full example and use CFD simulations to optimize performance and efficiency using SimScale. Scroll to the bottom to watch the FREE YouTube video tutorial!
Create a free SimScale account to try the cloud-based CFD simulation platform here https://www.simscale.com/ With over 100,000 users worldwide, SimScale is a revolutionary CAE platform based on the cloud that provides instant access to CFD and FEA Simulation Technology for quick and easy virtual testing, comparison, and optimization of designs across multiple industries, including HVAC, AEC, and electronics.
· Discover over 50 free, on-demand webinars on everything from ventilation or data center design and wind load analysis to aerospace, F1 and sports aerodynamics here: https://www.simscale.com/webinars-wor…
· Learn more about the benefits of using cloud-based engineering simulation and the SimScale community here: https://www.simscale.com/product/pricing
· Find thousands of ready-to-use simulation models created by SimScale users that you can copy and modify for your own analysis: https://www.simscale.com/projects/
Duct Design Methods
There are many different methods used to design ventilation systems, the most common being:
· Speed Reduction Method: (Residential or Small Commercial Facilities)
· Equal Friction Method: (medium to large commercial installations)
· Static recovery: Very large installations (concert halls, airports and industries)
We are going to focus on the equal friction method in this example because it is the most widely used method for commercial HVAC systems and it is fairly easy to follow.
design example
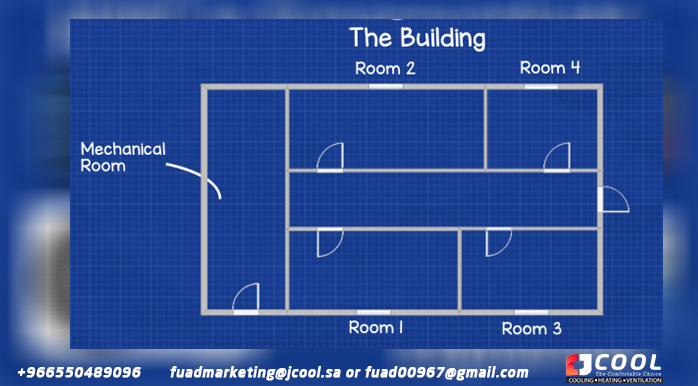 |
| The design of the building: how to design a duct system. |
So we'll jump right into designing a system. We are going to use a small engineering office as an example and we want to make a layout diagram of the building that we will use for design and calculations. This is a very simple building, it has only 4 offices, a corridor and a machine room where the fan, filters and air heater or cooler will be located.
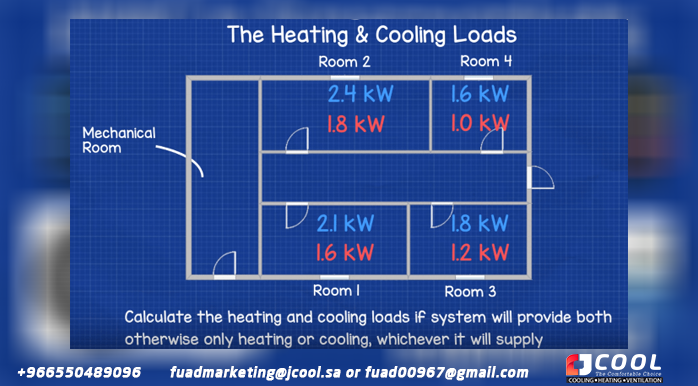 |
| Building Heating and Cooling Loads - Duct Sizing |
The first thing we need to do is calculate the heating and cooling loads for each room. I won't explain how to do it in this article, we'll have to cover it in a separate tutorial since it's a separate area.
Once you have them, just add them up to find what the largest load is, because we need to size the system so that it can run at peak demand. The cooling load is usually the highest, as in this case.
Now we need to convert the cooling loads to volume flow rates, but to do this we first need to convert them to mass flow rates, so we use the formula:
mpoint = Q / (cp x Δt)
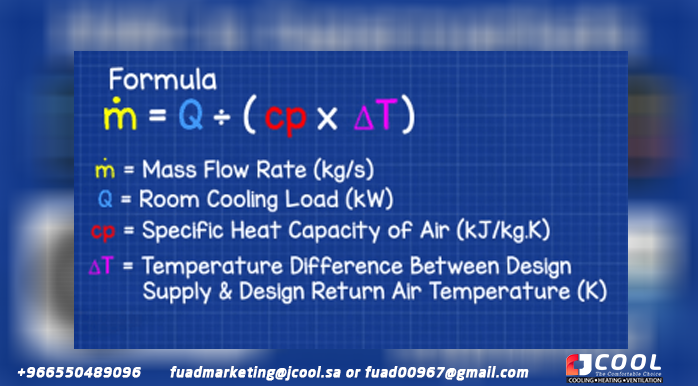 |
| Calculate the mass airflow of the cooling load |
We know all the values for this, so we can calculate the mass flow (how many kilograms per second of air must enter the room). If we look at the calculation for room 1, we see that 0.26 kg/s is needed. So we repeat this calculation for the rest of the room to find all the mass flow rates.
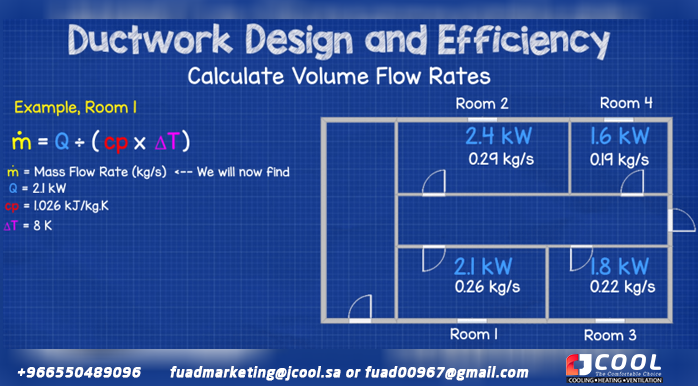 |
Now we can convert them to volumetric flow rates. To do this, we need the specific volume or density of the air. We will specify 21*c and assume an atmospheric pressure of 101.325 kPa. We can look this up in our air properties tables, but I like to use an online calculator http://bit.ly/2tyT8yp because it's faster. We simply add these numbers together and get an air density of 1.2 kg/m3.
You see, density has the units of kg/m3, but we need a specific volume which is m3/kg, so to convert we just take the inverse, which means calculating 1.2 to the -1 power. You can do this in Excel very quickly (copy and paste this = 1.2^-1) to get the answer of 0.83 m3/kg.
Now that we have that, we can calculate the volumetric flow using the formula:
vdot = mdot multiplied by v.
 |
| Calculate volumetric air flow from mass flow |
where vdot is equal to the volumetric flow rate, mdot is equal to the mass flow rate of the room, and v is equal to the specific volume that we just calculated.
So if we lower these values for room 1 we get a volumetric flow rate of 0.2158 m3/s, that is, the amount of air needed to enter the room to satisfy the cooling load. Repeat this calculation for all rooms.
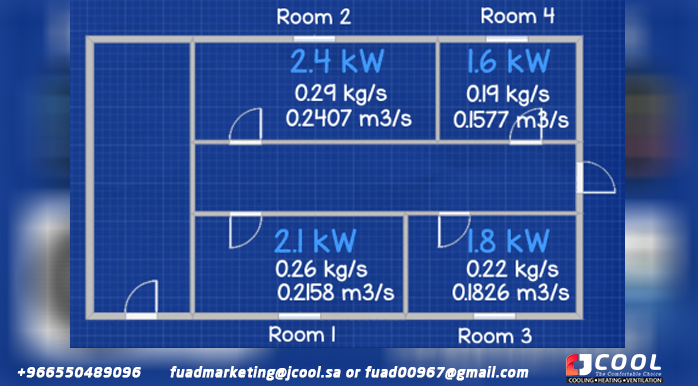 |
| Building Air Flows - Duct Sizing |
Now we'll draw our duct run on the floor plan so we can start sizing it.
 |
Before we go any further, we need to consider a few things that will play a big role in the overall efficiency of the system.
design considerations
The first is the shape of the ducts. The ducts are round, rectangular and flat oval. Round duct is by far the most energy efficient type and is what we will use in our practical example later. If we compare a round duct with a rectangular duct, we find that:
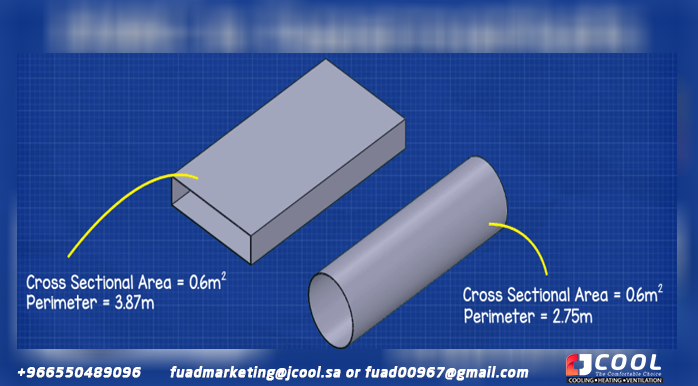 |
A round duct with a cross section of 0.6 m2 has a perimeter of 2.75 m
A rectangular duct of the same section has a perimeter of 3.87 m
Therefore, the rectangular duct requires more metal for its construction, adding more weight and cost to the design. The larger perimeter also means more air will come into contact with the material, adding friction to the system. Friction in a system means the fan has to work harder, leading to higher operating costs. Always use a round duct whenever possible, although in many cases a rectangular duct should be used as space is limited.
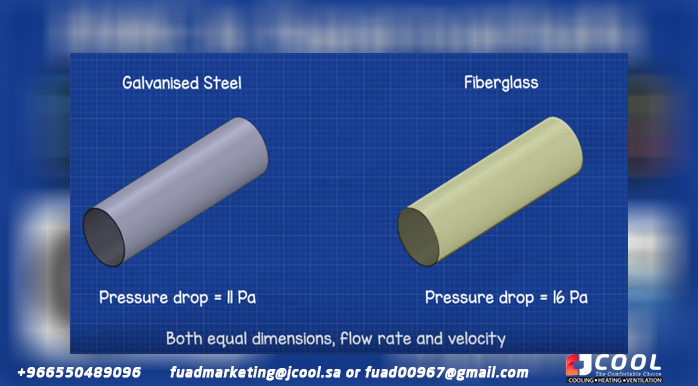 |
The second thing to consider is the material used for the ducting and the roughness of that material as this causes friction. For example, if we had two ducts, with the same dimensions, volume flow and velocity, the only difference is the material. One is standard galvanized steel and the other is fiberglass, the pressure drop over a distance of 10 m for this example is approximately 11 Pa for galvanized steel and 16 Pa for fiberglass.
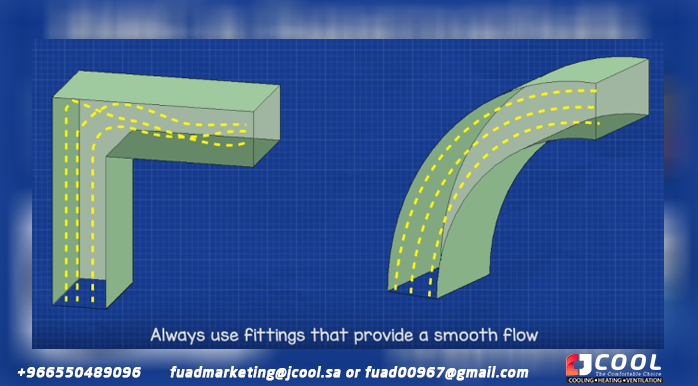 |
The third thing to consider is the dynamic losses caused by accessories. We want to use the softest fixtures possible for energy efficiency. For example, use long radius turns instead of right angles because the sudden change of direction wastes a lot of energy.
 |
| CFD Duct Simulations |
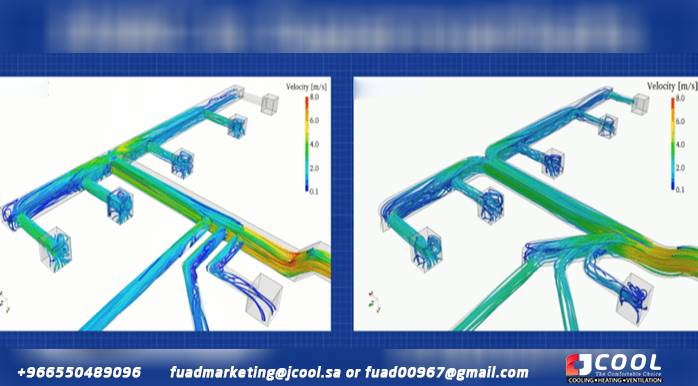
We can compare the performance of different duct designs quickly and easily using CFD or Computational Fluid Dynamics. These simulations were produced using a revolutionary cloud-based CFD and FEA engineering platform, by SimScale, who kindly sponsored this article.
You can access this software for free by clicking here,
SimScale is not limited to just duct design, it is also used for data centers, AEC applications, electronic design, as well as thermal and structural analysis.
One simple look at their site and you can find thousands of simulations for everything from buildings, HVAC systems, heat exchangers, pumps and valves to race cars and airplanes, all of which can be copied and used as templates for your own analysis. design.
They also offer free webinars, courses, and tutorials to help you set up and run your own simulations. If, like me, you have experience creating CFD simulations, you know that this type of software is usually very expensive and you will also need a powerful computer to run it.
However,With SimScale, everything can be done from a web browser. Since the platform is cloud-based, its servers do all the work and we can access our design simulations from anywhere, which makes our life as an engineer much easier.
So if you are an engineer, designer, architect, or just someone who wants to try out simulation technology, I highly recommend checking out this software, get your free account by following this link.
 |
| Standard and optimized CFD duct design |
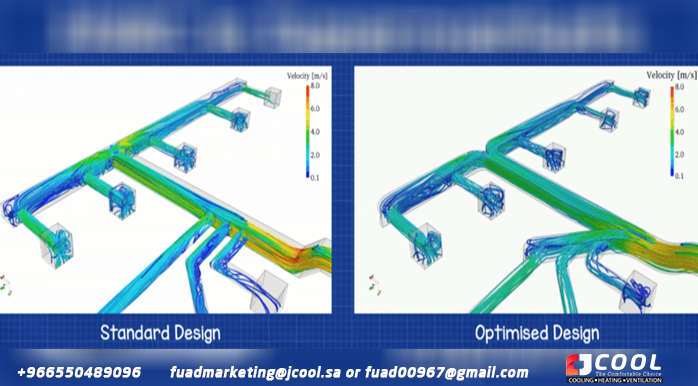
Now if we look at the comparison of the two layouts, we have a standard layout on the left and a more efficient layout on the right that has been optimized using simscale. Both designs use an air speed of 5 m/s, the colors represent speed, blue means low speed and red represents high speed regions.
 |
| Standard duct design |
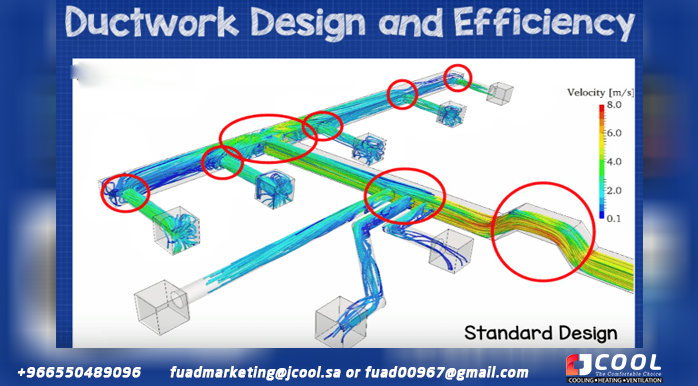
We can see from the color scale of the speed and the aerodynamic lines that in the design on the left, the intake air directly hits the tight curves present in the system, which causes the static pressure to increase. Tight turns cause a lot of recirculation areas in the ductwork, preventing air from moving smoothly.
The T-section at the end of the main duct causes the air to split suddenly and change direction. There is a lot of reflux here which again increases the static pressure and reduces the amount of air supplied.
The high velocity in the main duct that is caused by tight turns and tight turns reduces the flow in the left 3 branches..
 |
| Optimized energy efficient duct design |
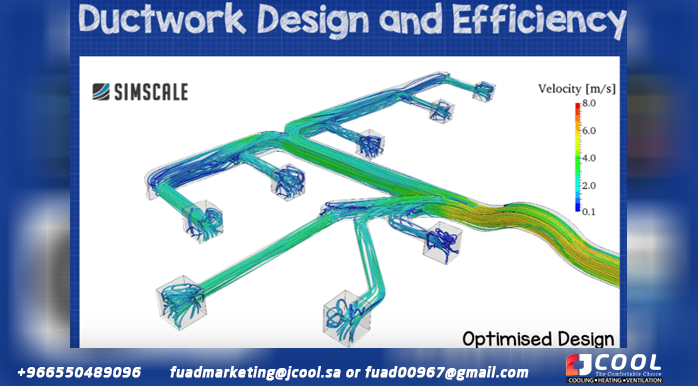
Looking now at the optimized layout on the right, we see that the fittings used follow a much smoother profile with no sudden clogging, recirculation or backflow, greatly improving airflow in the system. At the end of the main duct, the air is divided into two branches by a slightly curved T-section. This allows the air to change direction smoothly so there is no sudden increase in static pressure and the airflow to the parts has increased significantly.
All three branches of the main duct now receive the same airflow, greatly improving the design. This is because one additional branch now feeds the three smaller branches, allowing some of the air to smoothly separate from the main flow and feed those smaller branches.
With these considerations in place, we can return to ductwork design.
 |
| Conduit and Fitting Labels - Conduit Sizing |
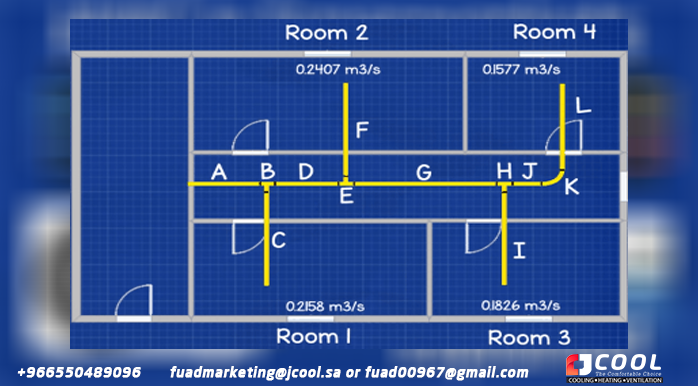
Now we need to label each section of the ductwork and fittings with a letter. Please note that we are just designing a very simple system here, so I only included basic ducting and fittings, not including items such as grilles, inlets, flex fittings, fire dampers, etc.
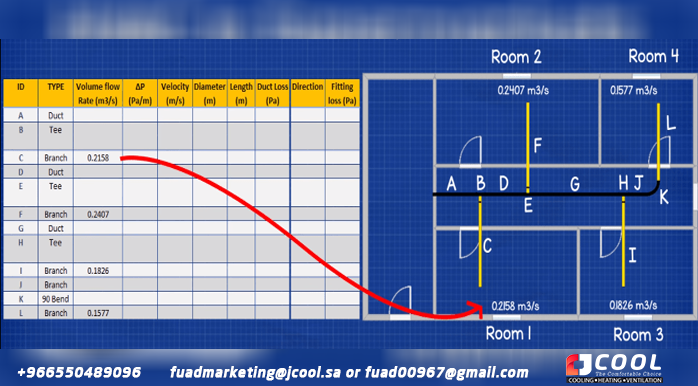
Now we want to create a table with the rows labeled according to the example. Each duct and fitting needs its own row, if the airflow is divided like with a T-section then we need to include a row for each direction, more on that later in the article.
Just add the letters to separate the lines, then state what type of fixture or conduit it is for.
 |
| Airflow Duct Diagram |
We can start to fill in some of the data, first we can include the volumetric flow rates for each of the branches, that's easy because it's just the volumetric flow rate for the room it serves. You can see on the board that I filled this out.
 |
| Main Duct Duct Flow Chart |
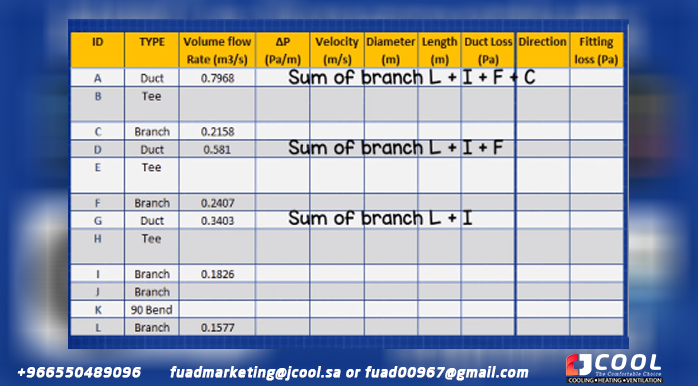
Then we can start sizing the main ducts. To do this, be sure to start with the furthest main duct. Then, simply add the volumetric flows of all the branches downstream of it. For main pipe G, we simply add the branches L and I. For D, it's just the sum of L I and F and for pipe A, it's the sum of L, I, F and C. Just enter them in the table.
From the approximate drawing, we measure the length of each section of the duct and enter it into the table.
Duct Sizing - How to Size Ducts
To size the ducts, you will need a duct sizing chart. You can get them from conduit manufacturers or industry organizations like CIBSE and ASHRAE. If you don't have any, you can find them at the following. Link 1 and Link 2
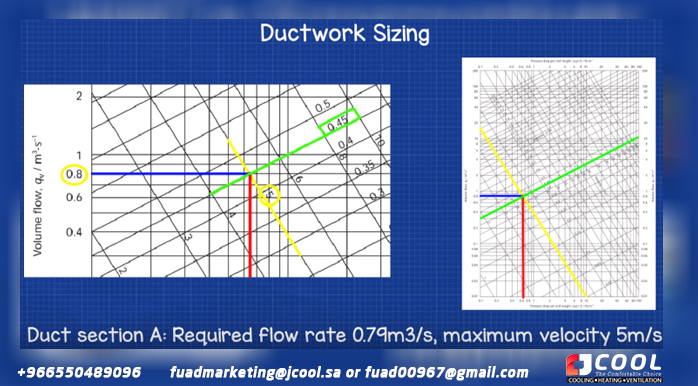
These cards contain a lot of information. We can use them to find the head loss per meter, the air velocity, the volume flow and also the size of the duct. The layout of the graph varies somewhat by manufacturer, but in this example the vertical lines correspond to the pressure drop per meter of duct. The horizontal lines correspond to the volumetric flow rate. The descending diagonals correspond to the velocity, the ascending diagonals to the diameter of the duct.
We begin the sizing from the first main duct, which is section A. To limit the noise in this section, we will specify that it can only have a maximum speed of 5 m/s. We know that this duct also requires a volume flow rate of 0.79 m3/s, so we can use velocity and volume flow to find the missing data.
 |
| Duct Sizing Example |
We take the graph and move up from the bottom left until we reach the volumetric flow rate of 0.79 m3/s. Next, we locate the 5 m/s velocity line and draw a line until we reach it. Then, to find the pressure drop, we draw a vertical line from this intersection. In this case we see that it comes out at 0.65 pa per meter. Add this number to the table. Since we use the equal head loss method, we can use this head loss for all duct lengths, so fill those in as well. We then scroll again and align our intersection with the diagonal lines up to see that this requires a 0.45m diameter duct, so we add that to the table as well.
We know the volumetric flow and pressure drop, so we can now calculate the values for section C and then the remaining ducts.
For the rest of the ducts we use the same method.
 |
| Equal Pressure Duct Sizing Method |
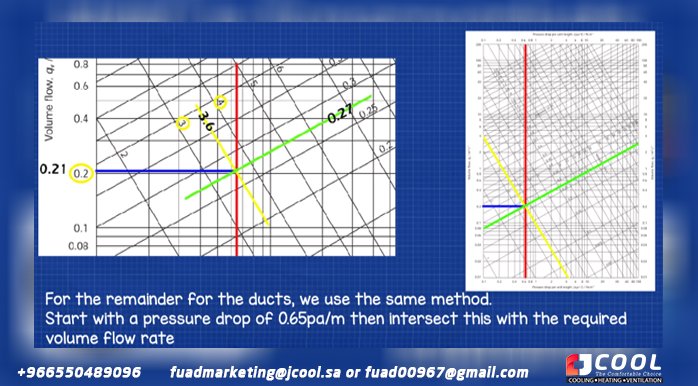
On the graph, we start by drawing a line from 0.65 pa/m to the top, then we draw a line through our required volumetric flow rate, in this case for section C we need 0.21 m3/s. At this intersection we draw a line to find the speed and we can see that it is on the 3 and 4 m/s lines, so we have to estimate the value, in this case it seems to be around 3 .6 m/s, so we add that to the graph. We then draw another line on the other diagonal grid to find the diameter of our duct, which in this case is about 0.27m and we'll add that to the table as well.
Repeat this last process for all remaining conduits and leads until the array is complete.
Now find the total duct losses for each duct and branch, this is very easy to do, just multiply the duct length by the pressure drop per meter, in our example we find it to be 0.65 pa/m. Do this for all the conduits and branches on the table.
Sizing of conduit accessories
The first accessory we will look at is the 90* elbow between the J and L tubes.
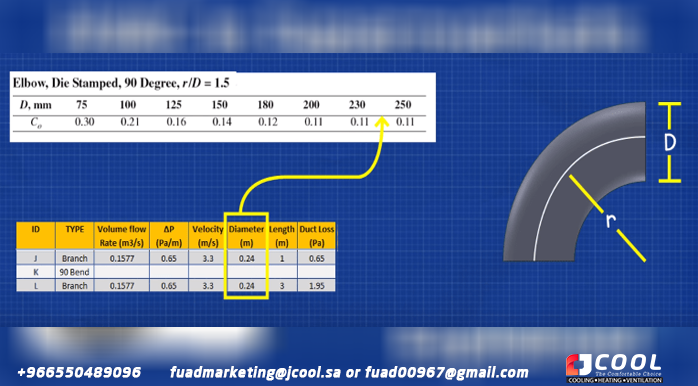
For this we look for our elbow loss factor from the manufacturer or industry body, you can find it by clicking on this link.
 |
| Elbow Fitting Pressure Drop Coefficient |
In this example, we can see that the coefficient comes out in 0.11
Next we need to calculate the dynamic loss caused by the curvature changing the direction of the flow. For this we use the formula Co multiplied by rho multiplied by v squared divided by 2 where co is our coefficient, rho is the air density and v is the velocity.
 |
| Formula for the pressure loss in the conduit elbow |
We already know all of these values, so if we drop the numbers, we get an answer of 0.718 pascals. So just add that to the table. (Watch the video at the bottom of the page to see how to calculate this.)
 |
| Tee pipe pressure drop |
The next accessory that we will see is the T that connects the main conduit with the branches, we will use the example of the T with the identifying letter H between G and J in the system. Now, for this we have to consider that the air is moving in two directions, directly through and also in the branch, so we have to do a calculation for both directions.
If we first look at air moving in a straight line, we first find the velocity ratio using the formula outflow velocity divided by inflow velocity. In this example, the air leaving is 3.3 m/s and the air entering is 4 m/s, giving us 0.83
Then we do another calculation to find the area ratio, this uses the formula diameter squared divided by diameter squared. In this example, the outer diameter is 0.24m and the inner diameter is 0.33m, so if we square them and then divide, we get 0.53
We now research the accessory we are using from the manufacturer or industry body, again link here for that.
 |
| Conduit Tee Size |
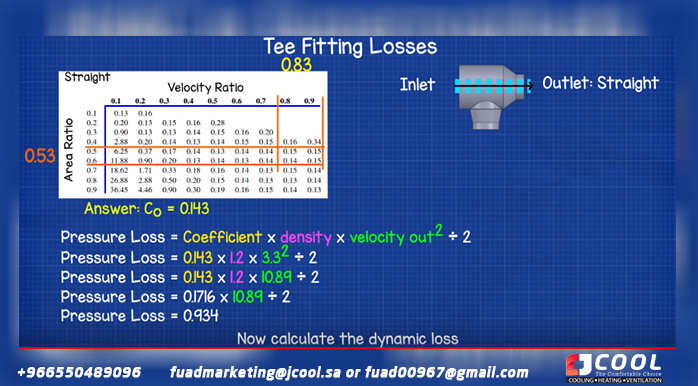
In the guides we find two tables, which one to use depends on the flow direction, we use the straight direction, so we locate this, then we look up each relationship to find our loss coefficient. Here you can see that the two values we calculated fall between the values listed in the table, so we need to perform bilinear interpolation. To save time we'll just use an online calculator to find this, link here (watch the video to learn how to perform a bilinear interpolation).
We fill in our values and find the answer of 0.143
 |
| Calculation of pressure loss at T |
Maintenance, we calculate the part dynamique pour le chemin droit à travers le té, using the formula co multiplié par rho multiplié par v au carré visé par 2. If we abaissons nos valeurs, we obtain the answer of 0.934 pascals, alors ajoutez cela in the frame.
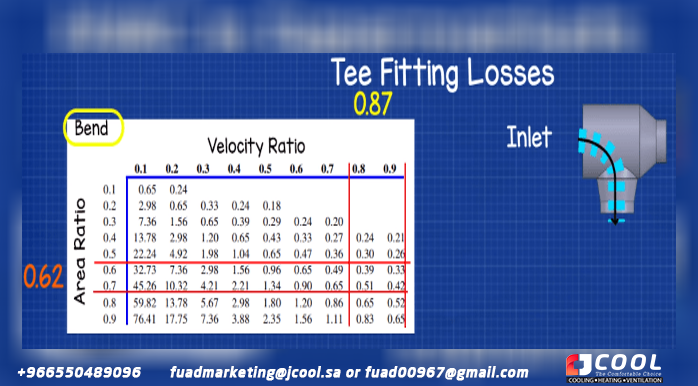
So we can calculate the dynamic loss of the air going around the curve. For this, we use the same formulas as before. The output speed was divided by the input speed to find our gear ratio. Next, we find the area ratio using the formula diameter squared divided by diameter squared. We take our values from our table and use 3.5 m/s divided by 4 m/s to get 0.875 for the velocity ratio and use 0.26 m squared divided by 0.33 m squared to get 0.62 for the ratio of areas.
 |
| Loss Elbow Tee |
Then we use the bend graph for the T-section, again between the values listed in the table, so we need to find the numbers using bilinear interpolation. We lower the values to get the answer of 0.3645 pascals. So add it to the board as well.
Now repeat this calculation for the other tees and fittings until the table is complete.
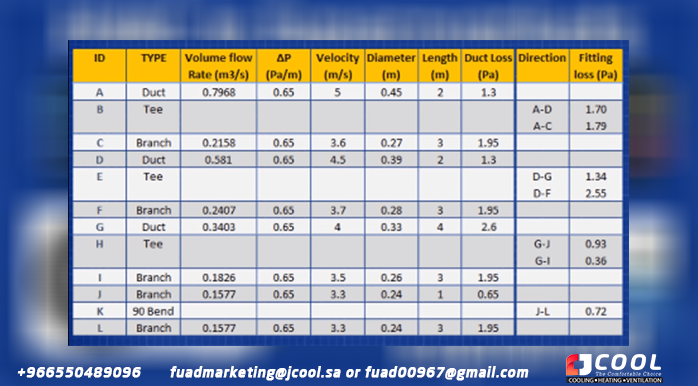 |
| Index Length Finder - Duct Sizing |
Index Length Finder - Duct Sizing
Next, we need to find the index run, which is the run with the highest pressure drop. This is usually the longest ride, but it can also be the ride with the most accessories.
It is easily found by adding all the pressure drops from the start to the outlet of each branch.
For example to go from A to C we lose 5.04pa
A(1.3pa)+B(1.79pa)+C(1.95pa)
For A to F we lose 8.8pa
A (1.3pa) + B (1.7pa) + D (1.3pa) + E (2.55pa) + F (1.95)
From A to I we lose 10.56
A (1.3pa) + B (1.7pa) + D (1.3pa) + E (1.34pa) + G (2.6pa) + H (0.36pa) + I (1.95pa)
For A to L we lose 12.5pa
A(1.3pa) + B (1.7pa) + D (1.3pa) + E (1.34pa) + G (2.6pa) + H (0.93pa) + J (0.65pa) + K (0.72pa) + L ( 1.95pa)
Therefore, the fan that we use must overcome the stroke with the highest loss, that is, A - L with 12.5 pa, this is the index stroke.
Duct Gates: System Balance
To balance the system, we need to add dampers on each of the branches to ensure equal pressure drop across all to achieve design flow rates in each room.
We can calculate the pressure drop that each shock must provide by simply subtracting the stroke loss from the stroke index.
A to C is 12.5pa - 5.04pa = 7.46pa
A to F is 12.5pa - 8.8pa = 3.7pa
A to I is 12.5pa - 10.56pa = 1.94pa
And that's our duct system. We'll do another tutorial covering other ways to improve the efficiency of your ductwork.
Do you need help maintaining and repairing an air conditioner?
It's hard to keep cool when the air conditioning isn't working. Whether it's repairs, air conditioning, regular maintenance, or assistance with choosing your new unit, JCOOL professionals can keep you comfortable all year
Jamjoom Cooling Systems Factory (JCOOL) products (condenser coil - evaporator coil - heat exchanger - air conditioning - cold evaporator - cooler - industrial air cooler - tube bundle - air heat exchanger)
Make a reservation immediately with the maintenance team before the summer heat intensifies.
Let us help you with a lot of maintenance and installation work on your next project.
To request the service: -
Jamjoom Cooling Systems Factory
Jeddah - Second Industrial City - Street 49
WhatsApp +966 550 489 096
fuadmarketing@jamjoomarcool.com
fuadmarketing@jcool.sa
Fuad00967@gmail.com
Eng/ Abu Hussam
#heatExchangers #condensers #evaporators #coolers #coils #airDucts #chiller's #jcool #Saudi_industry #cooling #ventilation #radiators #jcool #jamjoomCoil #jamjoom_cooling_systems_factory #jamjoom #saudiArabai #coolingtowers #cooling_tower #coolingcoils #heat_exchanger #heatexchanger #coolingsystems #cooling #chiller #hvac #jamjoom_hvac #jamjoom_cooling #global_cooling_tower #Brand_Saudi_Arabia #made_in_Saudi_Arabia #🇸🇦


Comments
Post a Comment